

Blog
Dynamic Contrast-Enhanced (DCE) MRI in Prostate Cancer: Contrast Kinetics and Lesion Assessment
Dynamic Contrast-Enhanced MRI (DCE-MRI) is a powerful imaging sequence that adds a functional dimension to prostate cancer diagnosis. While T2-weighted imaging provides detailed anatomical views and Diffusion-Weighted Imaging (DWI) reveals cellular density, DCE-MRI visualizes tumor vascularity and tissue perfusion. By tracking how a contrast agent moves through the prostate, this technique helps radiologists characterize suspicious lesions, assess their aggressiveness, and improve the accuracy of early detection. When combined with T2 and DWI sequences in a multiparametric MRI (mpMRI) exam, DCE-MRI provides critical information that helps differentiate cancerous tissue from benign conditions.
Understanding Dynamic Contrast-Enhanced (DCE) MRI
What is DCE-MRI and how does it work?
Dynamic Contrast-Enhanced MRI is a functional imaging technique used to assess tissue perfusion and blood vessel permeability. During a DCE MRI prostate cancer exam, a small amount of a gadolinium-based contrast agent is injected intravenously into the patient. As this agent travels through the bloodstream and into the prostate tissue, the MRI scanner rapidly acquires a series of images over time.
The gadolinium agent alters the magnetic properties of the surrounding tissue, causing it to appear brighter on T1-weighted images. Cancerous tumors often develop new, abnormal blood vessels—a process known as neoangiogenesis. These vessels are typically leakier and more abundant than those in healthy tissue. Consequently, the contrast agent accumulates more rapidly and in higher concentrations within a tumor, allowing it to be distinguished from surrounding benign prostate tissue. By analyzing these changes in signal intensity over time, dynamic contrast-enhanced prostate MRI provides vital information about a lesion’s underlying physiology, which is captured in its prostate MRI contrast kinetics.
The role of contrast kinetics in lesion detection
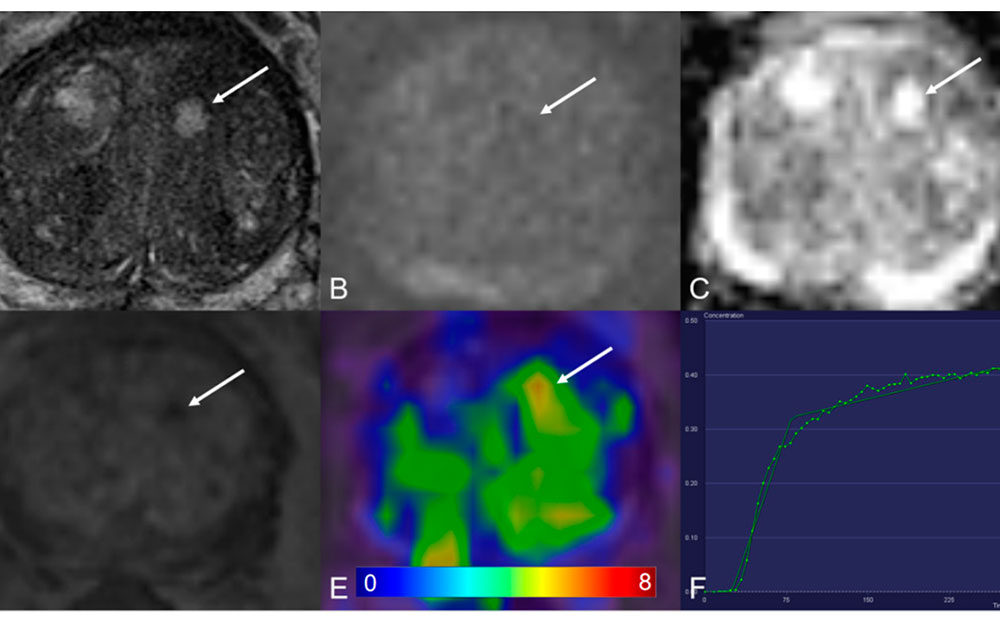
Contrast kinetics refers to the pattern of signal intensity changes over time after the contrast agent is administered. This pattern is often visualized on a graph, creating what are known as enhancement curves. These curves have three key phases:
- Wash-In: This is the initial, rapid increase in signal intensity as the contrast agent perfuses the tissue. Aggressive tumors tend to show a faster and steeper wash-in compared to healthy tissue or benign conditions like benign prostatic hyperplasia (BPH).
- Peak Enhancement: This represents the point of maximum signal intensity, indicating the peak concentration of the contrast agent within the tissue.
- Wash-Out: This phase shows the decrease in signal intensity as the contrast agent is cleared from the tissue. Cancerous lesions often exhibit a rapid wash-out, where the signal intensity drops quickly after its peak. In contrast, benign tissue typically shows a slower, more gradual wash-out or may continue to enhance over time (a persistent curve).
By evaluating these kinetic curves, radiologists can identify suspicious areas that behave differently from the surrounding healthy tissue, flagging them for closer inspection and potential biopsy.
Contrast Kinetics and Quantitative Parameters
While visual assessment of enhancement curves provides valuable qualitative insights, modern imaging techniques can extract even more data through quantitative analysis.
Pharmacokinetic models (Tofts, extended Tofts, Brix)
Pharmacokinetic models are mathematical formulas that transform the raw signal intensity data from a DCE-MRI scan into meaningful physiological parameters. These models help quantify the underlying biological processes of tissue perfusion and vascular permeability. The most common parameters derived from these models include:
- Ktrans (Transfer Constant): This parameter reflects the rate at which the contrast agent moves from the blood plasma into the extravascular extracellular space (the tissue outside the blood vessels). A higher Ktrans value often suggests increased blood flow and vessel permeability, which is a common characteristic of malignant tumors.
- Kep (Rate Constant): This measures the rate at which the contrast agent moves back from the tissue into the blood plasma. It essentially describes the speed of the wash-out phase.
- Ve (Extravascular Extracellular Volume Fraction): This parameter represents the volume of the tissue outside the blood vessels that is accessible to the contrast agent.
By calculating these values for each pixel in the imaging area, these models can generate parametric maps—color-coded images where the color of each pixel corresponds to its Ktrans, Kep, or Ve value.
Visual vs. quantitative interpretation
Radiologists use both visual and quantitative methods to interpret DCE-MRI data. Visual interpretation involves observing the enhancement curves and looking for the characteristic early enhancement and rapid wash-out associated with cancer. This approach is intuitive and fast, making it highly effective in many clinical scenarios.
Quantitative interpretation, using parametric maps of Ktrans, Kep, and Ve, offers an objective and reproducible way to assess tissue physiology. These maps can highlight subtle changes that may not be obvious from visual assessment alone. Quantitative analysis is particularly valuable in research settings for standardizing data across different studies and is increasingly used in clinical practice to provide additional confidence in a diagnosis. The combination of both visual and quantitative assessment provides the most comprehensive evaluation of a lesion.
Clinical Applications in Prostate Cancer Diagnosis
DCE-MRI is a cornerstone of multiparametric MRI, offering unique insights that enhance diagnostic accuracy and guide treatment decisions.
Detecting clinically significant prostate cancer
DCE-MRI plays a crucial role in the Prostate Imaging Reporting and Data System (PI-RADS), the standardized system for evaluating prostate MRI scans. For peripheral zone lesions, positive DCE (focal, early enhancement) can upgrade a PI-RADS 3 lesion—a lesion with an equivocal or uncertain likelihood of being clinically significant cancer—to a PI-RADS 4, indicating that cancer is likely present. This helps clarify ambiguous cases and ensures that patients with potentially aggressive tumors are identified for biopsy. The use of contrast helps improve the detection of clinically significant disease, separating it from indolent cancers that may not require immediate treatment.
Evaluating lesion aggressiveness and vascularity
The quantitative parameters derived from DCE-MRI, such as Ktrans and Kep, often correlate with tumor aggressiveness. Studies have shown that higher Ktrans values can be associated with higher Gleason scores and more aggressive tumor grades. This is because more aggressive tumors tend to have a denser and leakier network of blood vessels to support their rapid growth. This information helps clinicians not only detect cancer but also estimate its potential for progression, which is a critical factor in determining the most appropriate treatment pathway for a patient.
Post-treatment monitoring and recurrence detection
DCE-MRI is also a valuable tool for monitoring patients after treatment, such as radiation therapy or radical prostatectomy. Following treatment, scar tissue and inflammation can make it difficult to interpret anatomical images alone. DCE-MRI can help identify areas of early, focal enhancement that may indicate residual or recurrent disease. By highlighting areas with abnormal vascular activity, it allows for the early detection of recurrence, enabling timely intervention before the disease progresses further.
Technical Considerations and Optimization
Acquiring high-quality DCE-MRI data requires careful attention to technical details to ensure the results are accurate and reliable.
Contrast agent selection and dosage
DCE-MRI relies on gadolinium-based contrast agents (GBCAs). The specific type of agent and the dosage are standardized to ensure consistency. The injection is precisely timed with the start of the image acquisition to accurately capture the full kinetic curve, especially the critical wash-in phase. Patient safety is paramount, and clinicians screen for contraindications, such as severe renal impairment, to minimize any risks associated with the contrast agent.
Temporal resolution and acquisition parameters
To accurately model contrast kinetics, especially the rapid wash-in seen in tumors, images must be acquired very quickly. High temporal resolution—meaning a short time between successive images—is essential. If the time between images is too long, the true peak enhancement may be missed, leading to an inaccurate calculation of parameters like Ktrans. Radiologists and technologists must balance the need for high temporal resolution with the need for sufficient spatial resolution to clearly visualize the anatomy.
Motion artifacts and correction strategies
Patient motion, including subtle movements from breathing or rectal peristalsis, can cause significant artifacts in DCE-MRI data. Since the technique relies on comparing images acquired at different time points, even slight misalignments can corrupt the kinetic analysis. Motion correction algorithms are often used in post-processing to realign the images and minimize these artifacts, ensuring that the calculated kinetic parameters accurately reflect tissue physiology rather than patient movement.
Integrating DCE-MRI into AI and Radiomics Pipelines
The rich, quantitative data from DCE-MRI makes it an ideal input for advanced computational analysis, including radiomics and artificial intelligence (AI).
Radiomic features derived from DCE-MRI
Radiomics is a field that involves extracting a large number of quantitative features from medical images. For DCE-MRI, these features go far beyond simple Ktrans and Kep values. They can include:
- Histogram-based features: Describing the distribution of signal intensities or kinetic parameters within a lesion.
- Texture features: Quantifying the spatial patterns and heterogeneity within a tumor, which may relate to its underlying biology.
- Kinetic curve-based features: Analyzing the shape of the enhancement curve in greater detail, such as its steepness, time-to-peak, and wash-out slope.
These features provide a highly detailed, numerical profile of a tumor’s vascular characteristics.
Deep learning approaches for contrast-enhanced MRI
Deep learning models, particularly Convolutional Neural Networks (CNNs), can analyze DCE-MRI data to improve lesion classification. These AI models can be trained to recognize the complex spatial and temporal patterns associated with prostate cancer. By integrating information from DCE-MRI with data from T2-weighted and DWI sequences, hybrid deep learning models can achieve higher diagnostic accuracy than when using a single sequence alone. The quantitative features from DCE provide powerful signals that help the AI differentiate between benign and malignant tissue with greater confidence.
Challenges and Limitations
Despite its many advantages, DCE-MRI is not without its challenges.
Inter-patient and inter-scanner variability
The results of a DCE-MRI scan can vary due to differences between patients, MRI scanners from different vendors, and imaging protocols used at different institutions. This variability can make it challenging to compare quantitative results, such as Ktrans, across different sites. Standardization of acquisition protocols and post-processing methods is crucial to minimize this variability and make DCE data more robust and reproducible.
Over-reliance on contrast enhancement
While enhancement is a key indicator of suspicion, not all enhancing lesions are cancerous. Benign conditions such as prostatitis (inflammation) and BPH can also cause increased blood flow and show enhancement on DCE-MRI, leading to potential false positives. Therefore, it is essential to interpret DCE data in the context of the other MRI sequences (multiparametric MRI) and the patient’s clinical history.
Future of contrast-free techniques
Given the interest in reducing scan times and avoiding contrast agents when possible (bpMRI vs mpMRI), researchers are exploring contrast-free alternatives. Techniques like diffusion kurtosis imaging (DKI), which provides more detailed information about tissue microstructure than standard DWI, and synthetic DCE, where AI algorithms generate contrast-like maps from non-contrast images, show promise. These emerging methods may one day provide similar vascular information without requiring an injection.
Conclusion
Dynamic Contrast-Enhanced MRI is an indispensable component of modern prostate imaging. By providing a detailed profile of a lesion’s vascularity, it offers functional information that anatomical imaging alone cannot capture. Through the analysis of contrast kinetics, both visually and quantitatively, DCE-MRI enhances lesion detection, helps resolve ambiguous PI-RADS 3 cases, and provides insights into tumor aggressiveness. As a vital part of multiparametric MRI, it complements T2-weighted and diffusion-weighted imaging to deliver a comprehensive diagnostic picture. Furthermore, the quantitative data from DCE-MRI serves as a rich source of features for radiomics and AI-driven platforms, paving the way for even more precise and automated prostate cancer lesion classification in the future.
Pioneering Cancer Detection with AI and MRI (and CT)
At Bot Image™ AI, we’re on a mission to revolutionize medical imaging through cutting-edge artificial intelligence technology.
Contact Us